
When your computer suddenly freezes, restarts, or crashes to a blue screen, it feels frustrating. You might be in the middle of working on a project or playing a game, and out of nowhere, everything stops. You are likely asking yourself: How do I check my Windows error?
The good news is that Windows tracks almost everything that happens behind the scenes. Every program crash, driver failure, and hardware glitch leaves a footprint. You do not need to be a software developer to find these clues. Windows provides several built-in tools that turn confusing computer glitches into clear, actionable data.
In this complete 2026 guide, you will learn how to find your system error logs, read them without feeling overwhelmed, and understand what steps to take next.
Key Takeaways
- Reliability Monitor gives you the easiest timeline view of system crashes without confusing jargon.
- Event Viewer stores detailed system logs for deep technical investigation and specific Event IDs.
- Built-in command tools like SFC and DISM automatically scan for and fix corrupted system files.
- Minidump files hold key details about Blue Screen of Death (BSOD) crashes.
- Knowing how to identify error codes prevents unnecessary software reinstalls and saves time.
Why Finding the Source of Windows Errors Matters
When your PC malfunctions, it is tempting to just restart the machine and hope for the best. While a quick reboot solves minor temporary glitches, recurring problems usually signal an underlying fault. Ignoring these warnings can lead to data loss or hardware failure down the road.
Finding the exact error log helps you target the real issue. Instead of guessing whether your graphics card, system memory, or a rogue background update is breaking your PC, error logs give you direct answers. This saves you hours of blind troubleshooting and keeps your system running efficiently.
Method 1: Using Reliability Monitor for Quick Visual Insights
If you want the fastest answer to the question, How do I check my Windows error?, Reliability Monitor is your best starting point. Most people do not know this tool exists because Microsoft buries it inside the Control Panel, but it is by far the most user-friendly diagnostic feature in Windows.
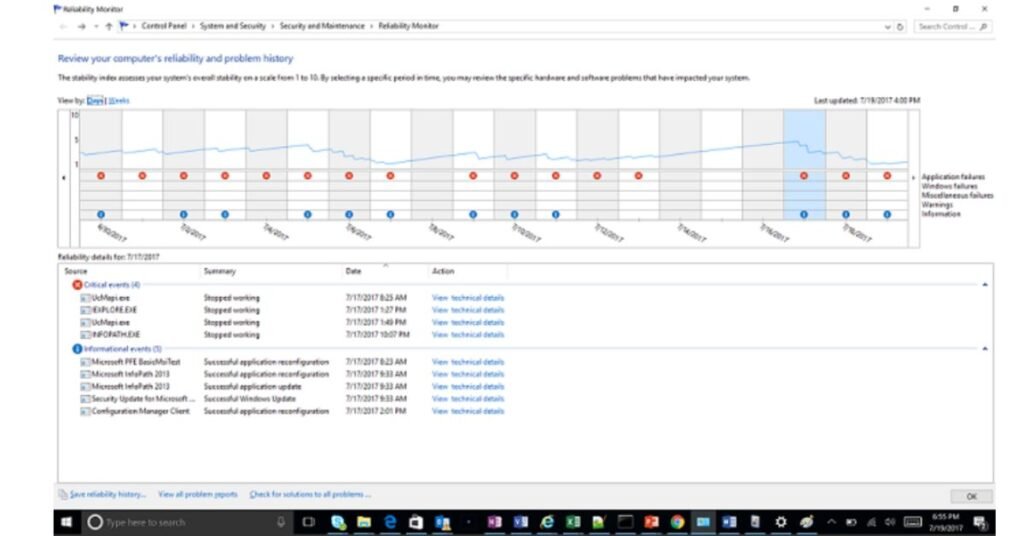
Reliability Monitor presents your computer history on a clean timeline rated from 1 to 10. Dips in the index graph line highlight days when errors occurred.
How to Open and Read Reliability History
To open Reliability Monitor, follow these simple steps:
- Press the Windows Key + R to open the Run dialog box.
- Type
perfmon /reland press Enter. - Wait a few seconds for Windows to build your system timeline.
Once the window opens, you will see a graph divided by days or weeks. Click on any day marked with a red index icon. The bottom panel will instantly filter to display the exact app or service that crashed. Double-clicking a specific failure brings up detailed technical information, including the faulting module name (such as a specific .dll or .sys driver file).
Pros and Cons of Reliability Monitor
Every diagnostic tool has its strengths and limitations depending on what type of crash you are experiencing:
- Pros:
- Displays a clean, chronological chart of system stability.
- Filters out harmless background activity so you focus only on real issues.
- Lets you export stability reports easily to share with tech support.
- Cons:
- Does not show deep low-level kernel events that happen before Windows boots up.
- Relies on Windows logging background services being active.
Method 2: Digging Deep with Event Viewer
For complex problems that do not show up in the Reliability Monitor, Event Viewer is the master database. Event Viewer logs every single system action, warning, application crash, and security change.
Reliability Monitor presents your computer history on a clean timeline rated from 1 to 10. Dips in the index graph line highlight days when errors occurred.
How to Open and Read Reliability History
To open Reliability Monitor, follow these simple steps:
- Press the Windows Key + R to open the Run dialog box.
- Type
perfmon /reland press Enter. - Wait a few seconds for Windows to build your system timeline.
Once the window opens, you will see a graph divided by days or weeks. Click on any day marked with a red index icon. The bottom panel will instantly filter to display the exact app or service that crashed. Double-clicking a specific failure brings up detailed technical information, including the faulting module name (such as a specific .dll or .sys driver file).
Pros and Cons of Reliability Monitor
Every diagnostic tool has its strengths and limitations depending on what type of crash you are experiencing:
- Pros:
- Displays a clean, chronological chart of system stability.
- Filters out harmless background activity so you focus only on real issues.
- Lets you export stability reports easily to share with tech support.
- Cons:
- Does not show deep low-level kernel events that happen before Windows boots up.
- Relies on Windows logging background services being active.
Method 2: Digging Deep with Event Viewer
For complex problems that do not show up in the Reliability Monitor, Event Viewer is the master database. Event Viewer logs every single system action, warning, application crash, and security change.
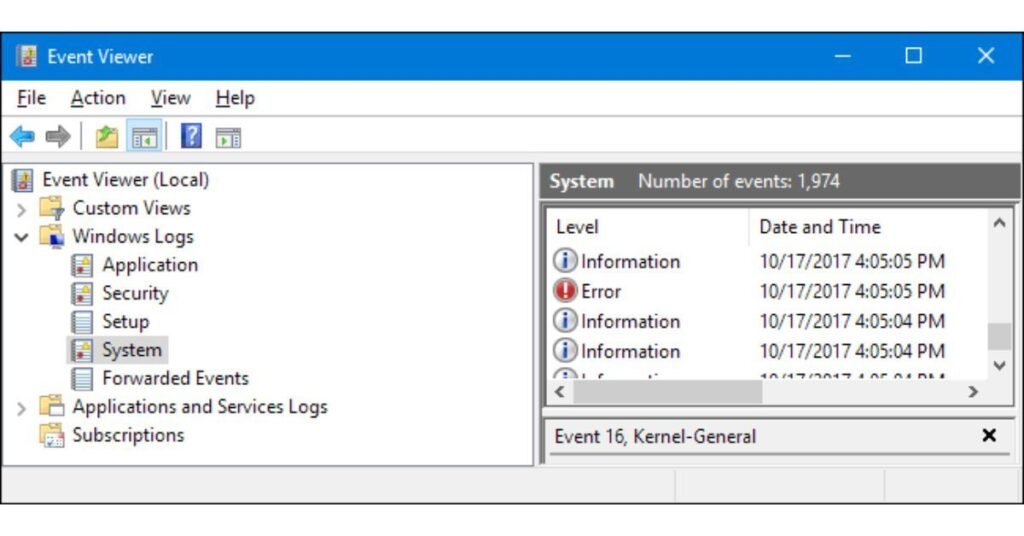
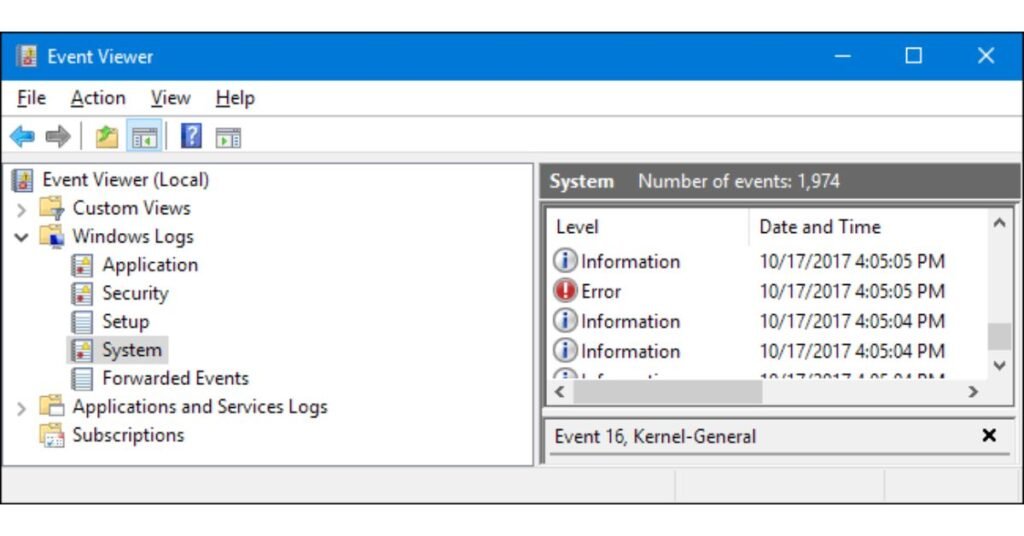
To launch Event Viewer, press Windows Key + X and choose Event Viewer from the menu, or press Win + R, type eventvwr.msc, and press Enter.
Navigating Windows Logs
Inside Event Viewer, expand the Windows Logs folder in the left sidebar. You will see five primary categories:
- Application: Tracks crashes and errors from installed desktop apps.
- System: Tracks core Windows OS services, hardware communication, and driver glitches.
- Security: Monitors user logins and permission checks.
- Setup: Holds logs related to system updates and feature rollouts.
To find critical issues fast, right-click either System or Application, click Filter Current Log, and check the boxes for Critical and Error. This hides routine informational logs and isolates the failures.
Critical Event IDs to Watch For
When reviewing your logs, keep an eye out for these common Windows Event IDs:
- Event ID 41 (Kernel-Power): Indicates your PC shut down unexpectedly without performing a clean power-off sequence.
- Event ID 1000 (Application Error): Confirms a desktop application experienced a fatal crash.
- Event ID 7034 (Service Control Manager): Shows that a critical background service stopped unexpectedly.
- Event ID 1001 (BugCheck): Generates right after your system recovers from a Blue Screen of Death.
Method 3: Running Command Prompt Diagnostics
Sometimes Windows errors prevent software interfaces from loading properly. In these situations, using built-in terminal utilities helps you diagnose and repair corrupted core files directly from the command line.
Scanning System Files with SFC and DISM
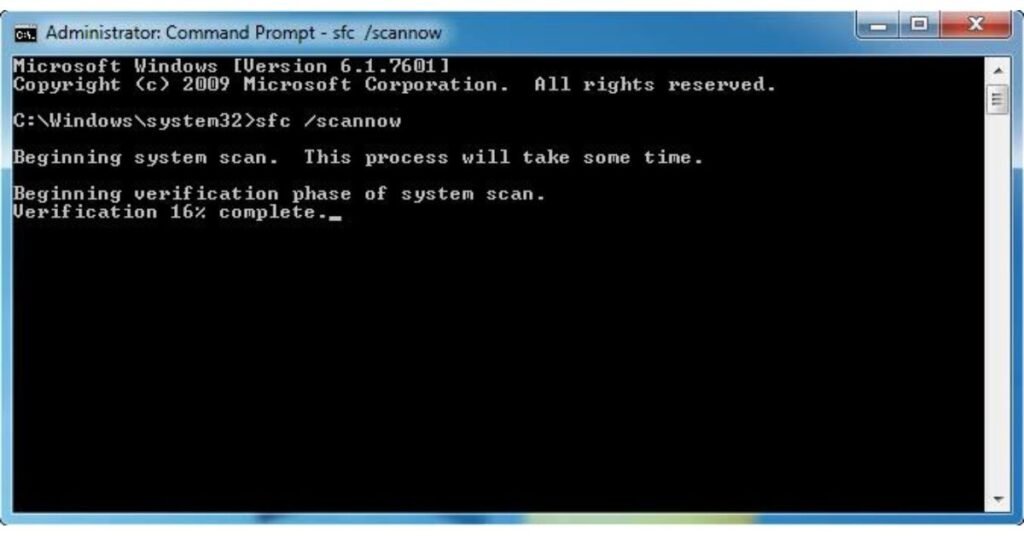
If your system crashes repeatedly, corrupt system binaries could be responsible. You can scan and restore these files using Command Prompt:
- Type
cmdinto your Windows Search bar. - Right-click Command Prompt and select Run as administrator.
- Type
sfc /scannowand press Enter.
The System File Checker (SFC) scans protected system files and replaces corrupted copies with fresh versions stored in system cache. If SFC discovers issues it cannot repair on its own, follow up by running the Deployment Image Servicing and Management (DISM) tool:
DISM /Online /Cleanup-Image /RestoreHealth
DISM connects directly to official Windows update servers to download clean copies of damaged core components.
Method 4: Checking Blue Screen Dump Files
A Blue Screen of Death (BSOD) occurs when the Windows kernel encounters a safety condition it cannot recover from. When this happens, Windows writes memory details into small diagnostic files called minidumps.
Minidump files are typically located in C:\Windows\Minidump. To analyze these files, Microsoft provides a free lightweight tool in the Microsoft Store named WinDbg (Windows Debugger).
Opening a dump file in WinDbg and executing the command !analyze -v analyzes the crash stack. It highlights the exact driver file or process responsible for triggering the blue screen.
If you regularly research practical troubleshooting methods or technical problem-solving strategies, resource platforms like Resovent offer useful insights into modern technical workflows and structured analytical thinking.
Comparing Windows Error Checking Tools
To help you decide which tool fits your current technical situation, here is a quick side-by-side overview:
| Tool Name | Difficulty | Best Used For | Key Advantage |
| Reliability Monitor | Beginner | General app crashes & daily stability tracking | Visual timeline with stability scoring |
| Event Viewer | Intermediate | Deep driver issues & specific Event ID lookups | Comprehensive system-wide logging |
| SFC & DISM | Beginner | Operating system corruption & boot errors | Scans and auto-repairs core files |
| WinDbg (Minidumps) | Advanced | Blue Screen (BSOD) root-cause analysis | Pinpoints exact faulting driver binaries |
How to Avoid System Risks When Fixing Windows Errors
Uncovering an error code is only half the battle; fixing it safely requires caution. Here are key safety practices to protect your data while troubleshooting:
- Create a Restore Point First: Always create a System Restore point before modifying system registry keys or uninstalling device drivers.
- Avoid Unverified “Registry Cleaner” Tools: Third-party cleaning software often deletes essential keys, causing more system instability than the original error.
- Update Drivers from Official Sources: Always download updated hardware drivers directly from the component manufacturer’s official website (such as NVIDIA, AMD, or Intel) rather than unverified third-party driver aggregators.
Advanced Troubleshooting Tools in 2026
Modern versions of Windows offer enhanced diagnostic tools that streamline system analysis. The Windows Terminal now combines PowerShell and Command Prompt into a single tabbed environment, making log querying faster.
PowerShell users can execute simple commands like Get-WinEvent to retrieve error summaries rapidly. For example, running:
Get-WinEvent -LogName System -MaxEvents 20 | Where-Object {$_.LevelDisplayName -eq "Error"}
…returns the 20 most recent critical system errors directly inside your console window without requiring you to click through nested menus.
What to Do After You Find Your Error Code
Once you locate your specific error code (such as 0xC0000005 or DRIVER_IRQL_NOT_LESS_OR_EQUAL), your path to a solution becomes clear:
- Search the Exact Code: Search the precise error string along with the faulting file name.
- Check Recent Updates: If errors started after a recent Windows update, consider rolling back that specific update.
- Run Hardware Diagnostics: If error logs consistently mention memory management, run the built-in Windows Memory Diagnostic tool to test your RAM sticks for hardware defects.
Conclusion: Taking Control of Your PC’s Health
Learning how to answer the question, How do I check my Windows error?, transforms computer troubleshooting from a guessing game into a structured process. By using simple built-in utilities like Reliability Monitor for quick visual overviews, or Event Viewer for deep error investigations, you can quickly isolate software bugs and hardware driver glitches.
Take a proactive approach to your computer’s health. The next time an unexpected error pops up, skip the panic, open your diagnostic logs, and pinpoint the issue within minutes.
Frequently Asked Questions (FAQs)
Q1: Where are Windows error logs stored on my hard drive?
Windows stores its primary event log files in the C:\Windows\System32\winevt\Logs directory in .evtx format.
Q2: Is it safe to clear all logs in Event Viewer?
Yes, clearing event logs is completely safe and will not harm your operating system or delete your personal files.
Q3: Why does Event Viewer show so many warnings even when my PC works fine?
Windows logs routine background activities, minor network drops, and non-critical service delays as warnings, which are completely normal during standard operation.
Q4: How do I export my Windows error logs to send to a technician?
In Event Viewer, right-click the desired log (like System), select Save All Events As, and save it as an .evtx or .txt file.
Q5: Can I check Windows errors using Safe Mode?
Yes, booting into Safe Mode allows you to run Event Viewer, Reliability Monitor, and SFC scans without third-party drivers getting in the way.
